
| |
Example of Automated Measurement:
This page illustrates the automated measurement of a cell's change in area over time. Similar methods could be used to measure change in shape, persistent directional movement, or increase/decrease in intensity which would correspond to protein or mRNA expression.
Blood was taken from a mouse which in which monocytes express EGFP constituatively (Suzanne Heck, Thomas Graf, et al.) and sandwiched between a coverslip and slide. The monocytes were imaged with epifluorescence with an Olympus 60X N.A. 1.4 objective at the rate of 8 frames per second with a Photometrics PXL camera.
Images were collected and analyzed with I.P. Lab Spectrum; any similar software, such as NIH-Image/Image-J or Metamorph, could be used to achieve the same goals.
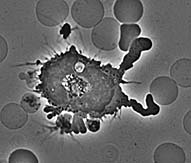
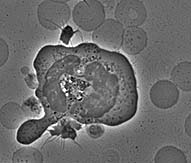
| Beginning Timepoint: | |||
 |
 |
||
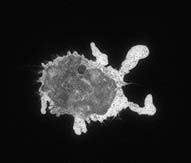
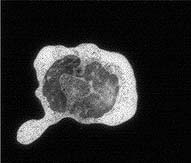
| End Timepoint: | |||
 |
 |
Quicktime movie: |
|
| The first timepoint is approximately 3 minutes after the cells
were plated on glass. Notice that the macrophage has already begun to spread
dramatically. It has also sent out very dynamic processes to touch neighboring
cells and to assess whether to phagocytose them. The end timepoint is 12 3/4 minutes later. The cell is now committed to frustrated phagocytosis; it has spread in an attempt to eat the glass surface it is on. |
|||
 |
The graph at the left shows the increased spreading of the monocyte as it attempts to ingest the glass coverslip. Small spikes show quick variations such as long protrusions which quickly retract. These data were generated from the movie by an automated process outlined below. |
 |
The diagram at the left shows the outlines of the cell at all time points. The numbers at the center show the location of the centroid of the cell and the path traveled. |
 |
The quantitation of each frame in the time lapse movie was achieved using the script at the left. Before running the script, the user chooses the threshold values that the cell needs to be extracted from other features in the image. For instance, this image, after conversion using the auto-normalize function for each frame to convert from the original 12 bit (4096 gray scales) data to a byte (256 gray scales), required a range of 54 to 255. |
![]()
last revised 2 May 2000 by mc