
| |
| Why deconvolution? |
| Deconvolution provides the
same exclusion of out of focus blur at a given point as confocal microscopy does, but the
mechanism is mathematical processing by computer. In its best case, having been given the
size of each pixel and information about the particulars of the optics, an algorithm
excludes out of focus blur that is not from light scattering in the plane of focus and
reassigns scattered light that should be in the plane of focus to its proper
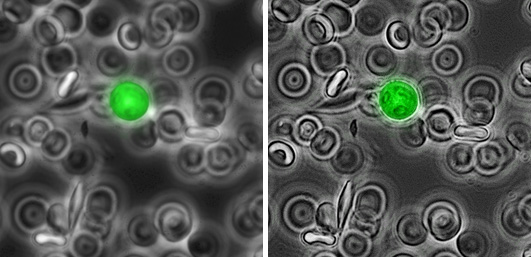
location. Practically, the deconvolution illustrated below shows exclusion of out of
focus light with approximation of reassignment or sharpening. The figure below shows a drop of diluted mouse blood from a mouse that expresses GFP in specific blood cells sandwiched between a coverslip and slide and imaged with the Olympus IX70 inverted microscope with a 60X N.A. 1.4 objective and a 1.5X eyepiece. Images were collected with a Photometrics Censys cooled CCD camera. Both images show the fluorescent signal from one cell superimposed on the phase contrast image of the whole field. The image on the left is raw data. The image on the right is sample deconvolution with VayTek Hazebuster. |
| The confocal microscopes may be used
only with samples that are bright enough to see clearly by eye and that have a narrow
dynamic range. Dim samples require intense illumination (which promotes bleaching) and
high gain settings (which increase noise). Samples with very bright areas and very dark
areas cannot be imaged by the confocal microscopes which are limited to a narrow range of
intensities. The cooled CCD cameras used to collect images for deconvolution can include in one image both very dim and very bright intensities. Weak intensities (either weak staining or dyes that bleach quickly excited with attenuated light) can be collected with integration over time without increase of noise associated with the voltage increase necessary in a fixed speed confocal. Researchers who have demanding samples seriously should consider embracing deconvolution as an alternative to direct confocal microscopy. |
 |
|
| Left: RAW DATA of GFP expressing cell superimposed on a phase contrast image of a field of cells.. |
Right: DECONVOLVED image from left panel using the Hazebuster quick deconvolution method.. |
| Cells courtesy of Dr. Thomas Graf. |
Technical details of different algoriths:
From an email by Wes Wallace <wwallace@BROWN.EDU> to the Confocal Microscopy List <CONFOCAL@LISTSERV.ACSU.BUFFALO.EDU> on 24 Mar 2000.To clear up some of the recommendations surrounding deconvolution software, I think the following information should be noted.
There are four kinds of deconvolution algorithms.
1. "Nearest Neighbor" - will run very fast on even the junkiest computer, however, does not result in much improvement, and furthermore, does not preserve brightness ratios.
2. Empirical Point-spread Function - the standard deconvolution software that most packages offer. This is potentially the highest-resolution method but if the empirical point-spread function is not acquired under incredibly rigorous conditions, the result is worse than nothing.
3. "Calculated Point-spread Function" - this type of algorithm is usually offered along with packages whose main selling point is empirical point-spread function. here instead of acquiring an empirical psf, the software calculates a point-spread function based on the optical specs of your microscope (i.e. numerical aperture, wavelength of light). the result is OK, but inferior to blind deconvolution.
4. Blind deconvolution. This is only offered by Autoquant in their Autodeblur package. It can be considered the 'sport utility vehicle' of deconvolution. Potentially, an empirical point-spread function can give higher resolution -- just as potentially, a Ferrari can outperform a Jeep. However, in a real situation you are probably going to have more freedom and versatility using the Jeep.